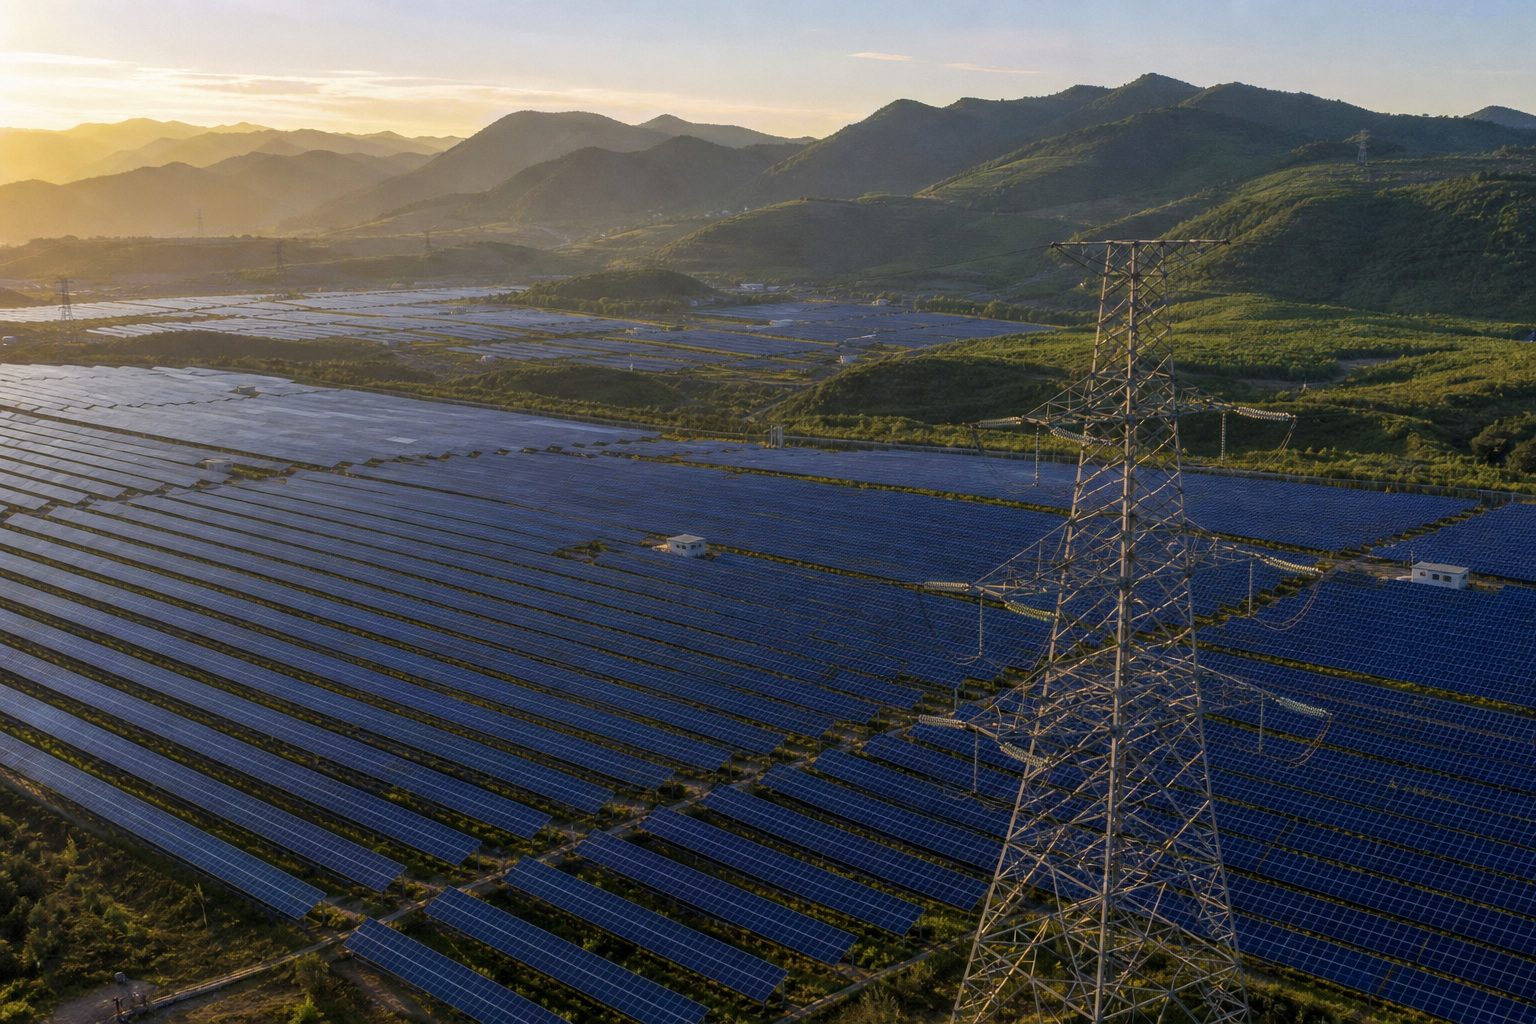
In June 2025, Chinese crews connected 92.92 gigawatts of solar panels to the national grid in a single month, according to National Energy Administration (NEA) installation data. That is more solar capacity in 31 days than the United States, the world's second-largest solar market, built in all of the previous year. The surge was driven by a hard deadline: from 1 June, new renewable projects would lose guaranteed prices and have to sell their power on the open market, so developers raced to commission everything they could.
A few weeks later, in early July 2025, China's electricity demand hit a record of about 1.51 billion kilowatts as a heatwave settled over the country, the NEA reported. At seven in the evening, when air conditioners ran hardest and factory shifts still hummed, solar panels contributed essentially nothing. The difference between those two records, one measured in gigawatts and the other in delivered electricity at a specific hour, is the story of China's power system.
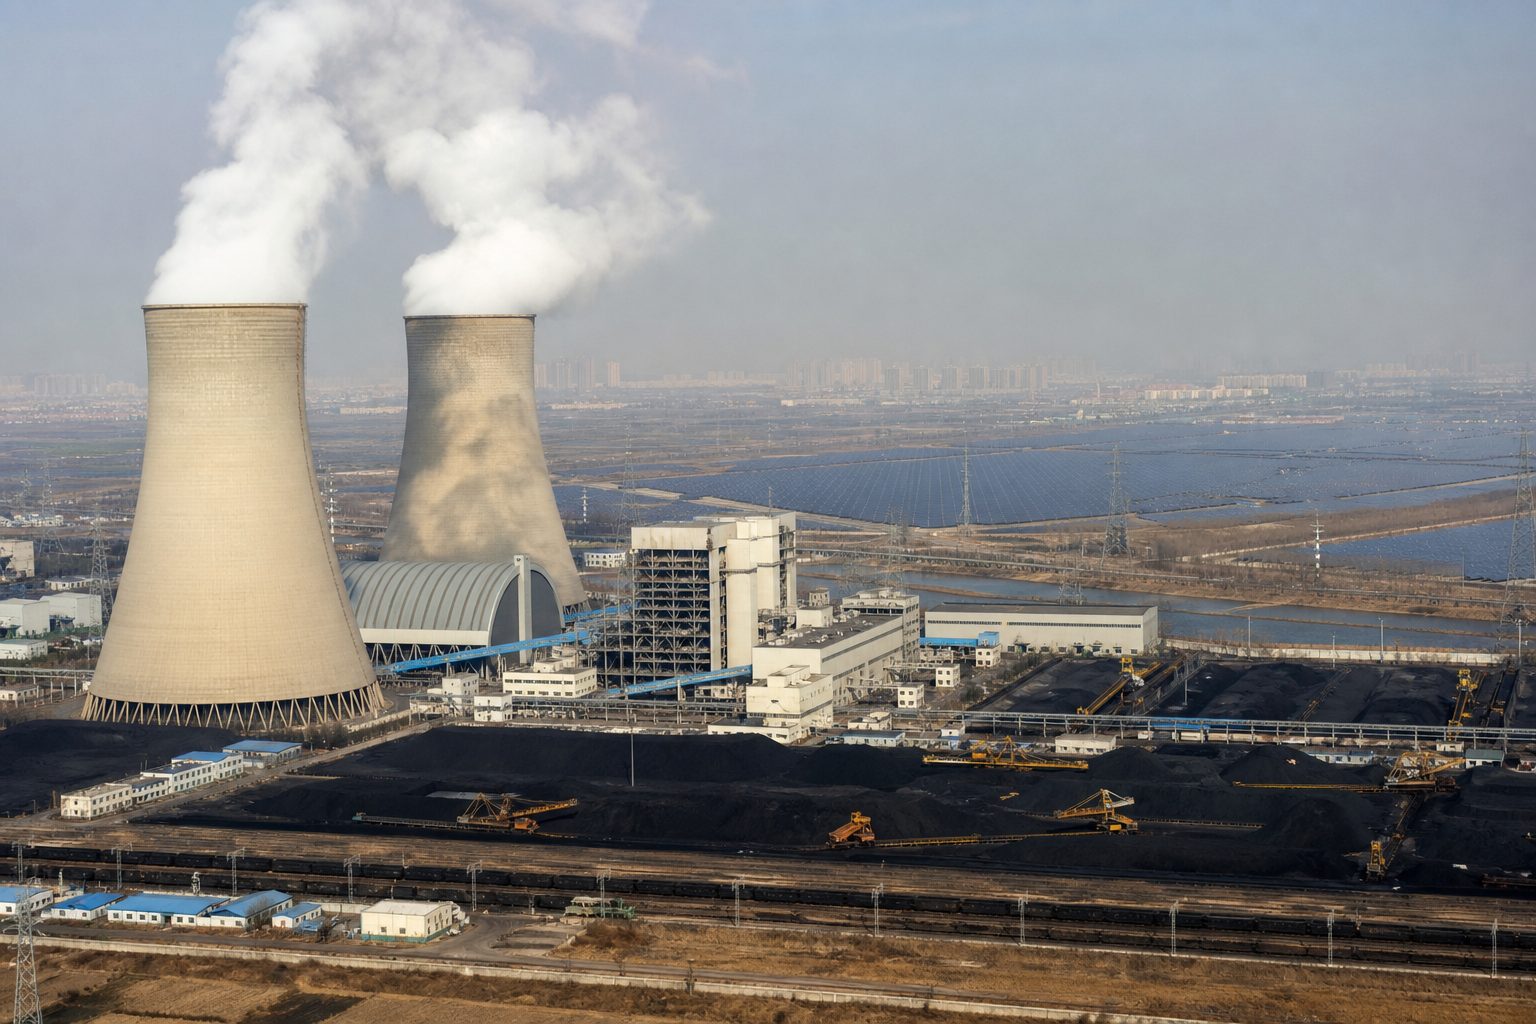
China has now reached the point where installed solar capacity matches or exceeds coal capacity, a symbolic reversal almost no analyst predicted a decade ago. Yet coal still generates the majority of China's electricity, and on the evening peak it carries something closer to the entire system. What follows is an examination of why: the storage, transmission, dispatch and market machinery beneath the headline numbers, and what its limits mean for 1.4 billion electricity users, for global carbon emissions (China produces roughly a third of energy-related CO2, with coal power the largest single slice), and for everyone watching whether renewable energy can actually displace fossil fuel or merely pile up alongside it.
What the headline milestone actually measures
First, some precision about which milestone happened when, because the record is routinely muddled.
The verified crossing came in June 2024. NEA first-half data showed wind and solar capacity together reaching about 1,180 gigawatts, overtaking the roughly 1,150 gigawatts of coal-fired capacity for the first time, as Reuters reported at the time. Solar alone had not yet caught coal. At the end of 2024, official statistics put solar at 886.66 GW against a coal fleet of roughly 1,190 GW, or about 36 percent of China's total 3,349 GW of installed capacity, according to the China Electricity Council (CEC), the industry's main trade and statistics body.
The solar-only crossing was forecast by the CEC, in its January 2025 supply-demand outlook, to arrive by the end of 2025. That forecast was consistent with what followed: solar installations hit 212 GW in the first half of 2025 alone. On the trajectory implied by the official monthly data, the question was the month, not the outcome. For this article, the distinction matters less than what it measures: nameplate capacity, the maximum a generator could produce under perfect conditions, not what it actually delivers.
The generation ledger looks entirely different. In 2024, solar produced about 834 terawatt-hours of electricity, roughly 9 percent of national generation. Wind produced about 992 TWh. Together they reached just under one-fifth of output, based on CEC figures and the National Bureau of Statistics' total of 9,418.6 TWh. Coal-fired units, from about a third of installed capacity, produced around 60 percent, though estimates vary with statistical scope, landing anywhere from the mid-50s to low-60s percent depending on whether broader datasets like Ember's are used.
| Source | Share of installed capacity (end-2024) | Share of electricity generated (2024) |
|---|---|---|
| Solar | ~26% | ~9% |
| Wind | ~16% | ~10% |
| Coal | ~36% | ~60% |
So when coverage says coal "still generates twice as much electricity" as solar, that phrasing understates the gap severalfold. Coal generated roughly seven times what solar alone produced in 2024, and about three times what wind and solar combined delivered. The capacity crown changed hands. The electricity crown did not.
Why 1 GW of solar is not 1 GW of coal
The first explanation is arithmetic. Chinese solar farms, averaging deserts and rooftops together, run the equivalent of roughly 1,200 to 1,300 full-load hours a year in recent CEC and NEA statistics, a capacity factor around 14 to 15 percent. Coal units have averaged roughly 4,500 to 4,700 hours, over half of the hours in a year. One gigawatt of coal capacity therefore produces about three and a half times as much electricity over a year as one gigawatt of solar capacity. Replace a gigawatt of coal with panels and you need close to four gigawatts of them, before you have spent a moment thinking about timing.
Timing is the deeper problem. Electricity is not a stockpile. The grid holds supply and demand in instantaneous balance at 50 hertz, every second of every day. A generator's value to the system depends not just on how much energy it provides over a year, but whether it is there at the moments the system needs it. China's peak demand arrives on hot summer evenings, after the sun has set. Solar's contribution to that evening peak is zero, whatever June's installation records say.
Grid engineers call this capacity credit: the fraction of nameplate a planner can count on during periods of maximum stress. Coal plants, when fueled and functioning, carry most of their nameplate as credit. Solar carries very little of its own, which is why a province can hold more gigawatts of renewable capacity than coal and still feel short of firm power at eight in the evening.
Where this story sits
5 related pieces
Read it →
Hover a story · click to read
 No. 53 · Sep 23, 2026Aurora's 96-MW Proof: Inside the Certification Bet on Software-Defined Grid Capacity
 No. 54 · Sep 23, 2026The Foreign Dependencies Inside China’s State AI Clouds
 No. 37 · Sep 5, 2026U.S. Grid Cyber Rules Are Finally Catching Up With Virtualized Operations
 No. 33 · Sep 5, 2026U.S.-China AI talks could make autonomous cyberattacks a matter of strategic stability
 No. 47 · Sep 14, 2026What breaks if China stops exporting rare-earth magnets tomorrow
Where does unused sunlight go?
When panels make power the grid cannot accept, operators dispatch them off. The industry term is curtailment, and its trajectory is the clearest symptom of the absorption gap.
China spent much of the last decade fighting curtailment down. National average curtailment rates, tracked by the National Renewable Energy Information Management Centre, fell to roughly 2 to 3 percent for wind and solar by 2022 to 2023. That progress has now reversed. National averages crept upward through 2024 into the mid-single digits, with pronounced regional stress: official utilization data reported by S&P Global Commodity Insights and specialist trade press showed curtailment above 10 percent in Tibet and elevated single-digit rates across northwestern provinces such as Qinghai, Gansu, and Ningxia, precisely the regions hosting the giant desert solar bases.
Beijing's response was telling. A State Council energy conservation and carbon reduction action plan issued in May 2024 formally loosened the utilization standard in constrained regions, effectively tolerating curtailment rates approaching 10 percent where absorption is difficult, relaxing what had been a hard 95 percent utilization expectation. Analysts read this as an acknowledgment that the build-out had outrun the wires.
Two caveats belong with these numbers. Official curtailment is typically measured at utility-scale plants against theoretical output. Distributed rooftop solar, which has exploded across rural counties in Shandong, Hebei, and Henan, sits on low-voltage distribution grids that were never designed to host generation at this density. By late 2023 and through 2024, local authorities in well over a hundred counties had designated "red zones" and paused new rooftop connections entirely, Reuters and industry data trackers reported, because local grids could not absorb more. Losses in that segment are largely invisible to national curtailment statistics, and analysts quoted in Chinese and international trade press argue true system losses run higher than headline rates suggest.
This is also where national accounting becomes slippery. NEA capacity figures count everything connected, whether or not the local grid can carry it away. A solar farm inside a congested provincial pocket counts just as much toward the national total as one sitting beside a major substation. The national number is real, but it does not describe deliverable capacity.
Why can't the batteries catch up?
If electricity were storable at scale, none of this would matter much. It is not yet.
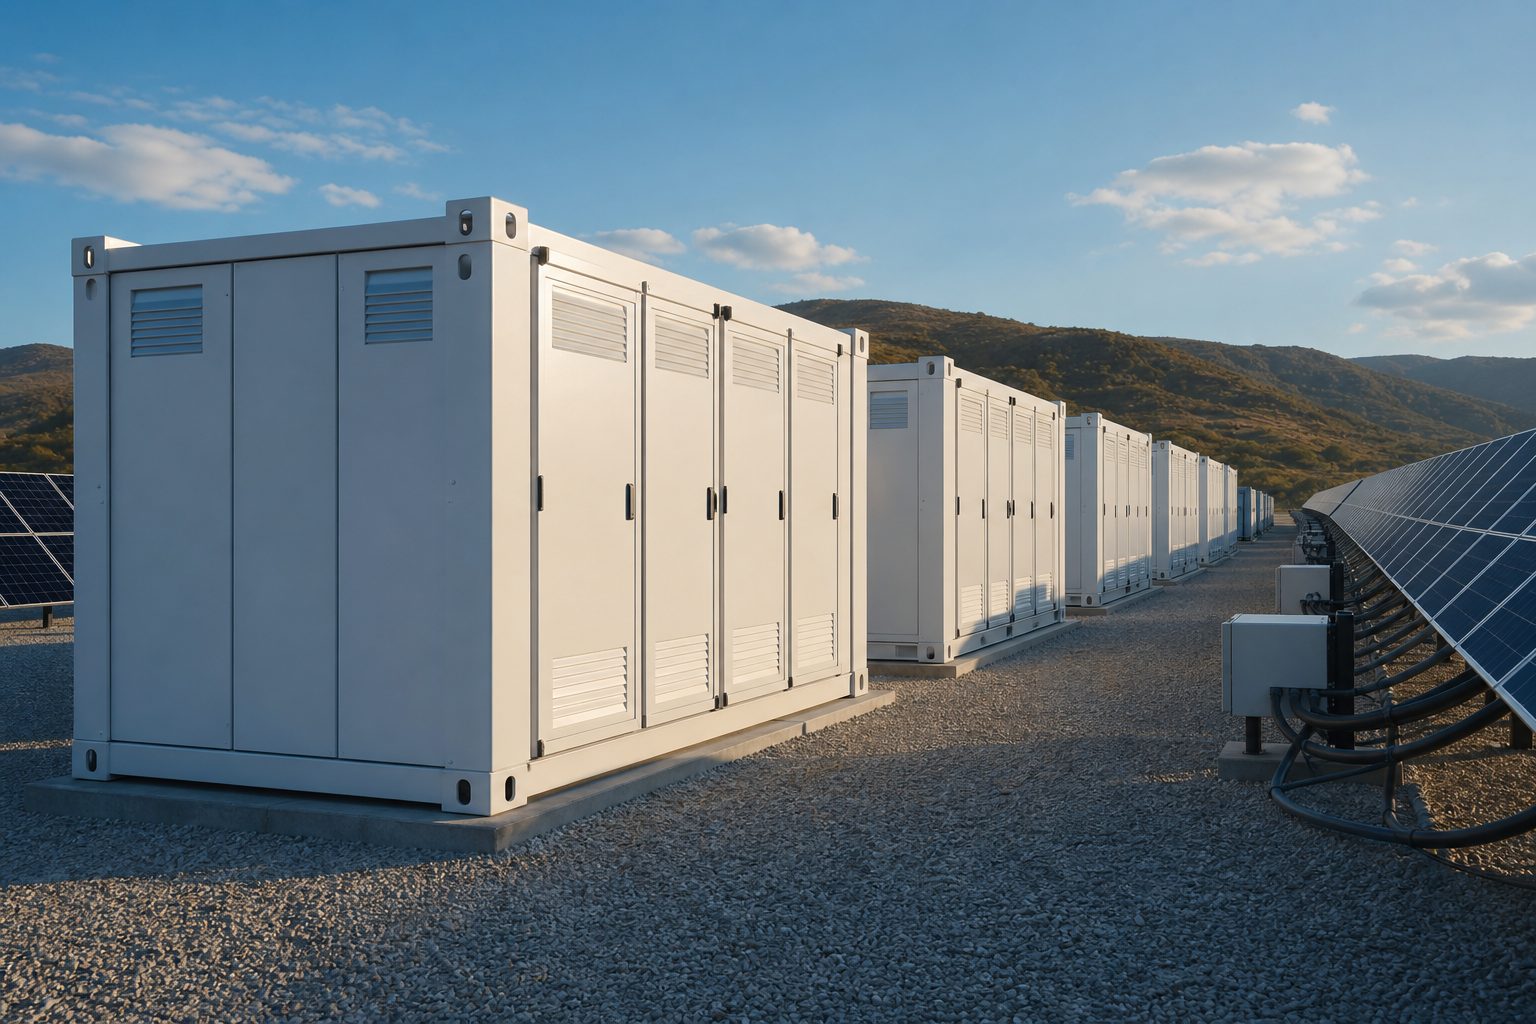
China's storage build-out is genuinely rapid by world standards. The NEA's "new-type energy storage" tally, overwhelmingly lithium-ion batteries, reached 73.76 GW and 168 gigawatt-hours by the end of 2024, more than doubling within a year. Pumped hydro, the workhorse technology, stood at roughly 58 GW, and the NEA's 2021 long-term plan targets 120 GW by 2030.
Now set that against the panels. Combined battery and pumped capacity of about 132 GW equals roughly 15 percent of solar's 886 GW nameplate. The energy comparison is harsher: 168 GWh of battery storage equals around 7 percent of one average day's solar output in 2024, a figure derived directly from the NEA generation and storage statistics. The average battery in the fleet holds about 2.3 hours of its power rating, a duration suited to shaving short midday spikes, not to moving solar energy from noon to the seven-hour evening block, and certainly not to spanning a cloudy week or a seasonal hydro deficit.
There is a subtler failure as well. For years most provinces conditioned renewable project approvals on developers co-installing storage, typically 10 to 20 percent of capacity for two hours. The result was a wave of box-ticking batteries bolted onto solar farms that grid operators rarely asked to run. Caixin and other Chinese financial media, along with analysts at groups such as the Institute for Energy Economics and Financial Analysis, have documented utilization at some mandatory co-located facilities in the low double digits of potential. Storage built to secure a permit is not the same asset as storage built to serve a system. Notably, the February 2025 pricing reform known as Document 136 explicitly barred making storage co-installation a precondition for project approval, a quiet admission that the mandate model had produced capacity without function.
Can the wires move the power east?
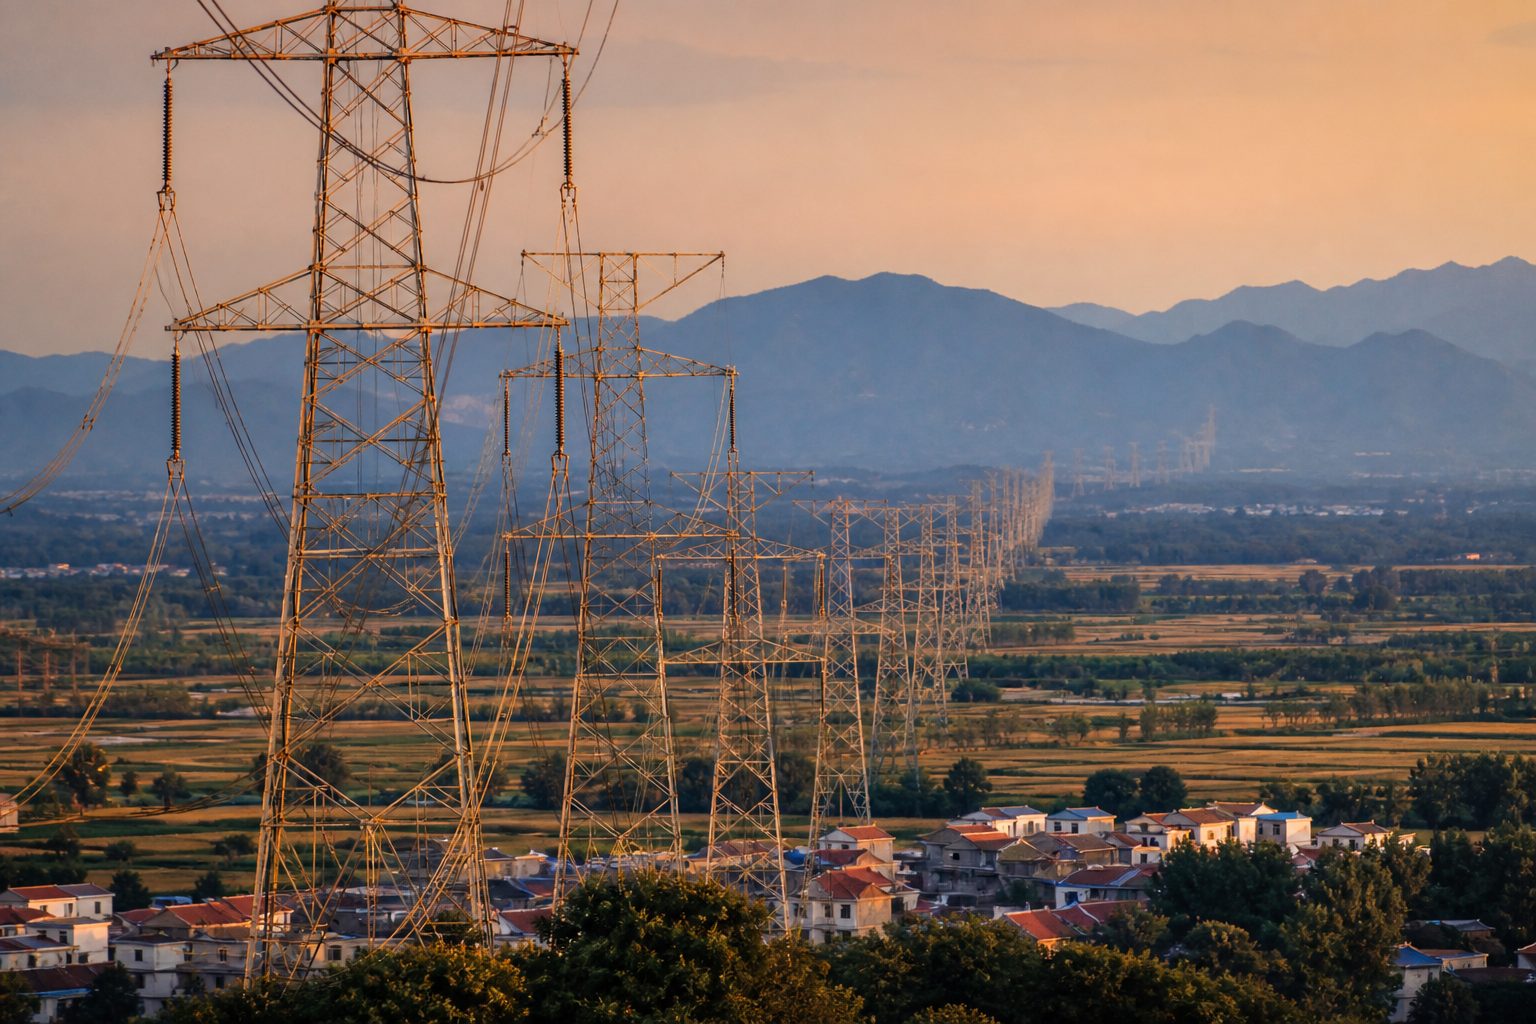
China's geographic mismatch is stark. The best solar resources sit in the northwest: Qinghai, Gansu, Ningxia, Inner Mongolia, Xinjiang. The demand sits 2,000 to 3,000 kilometers east, along the coast. Moving bulk power that far is the job of ultra-high-voltage (UHV) transmission, and China builds it on a scale no other country attempts. The Changji-Guquan line in Xinjiang-to-Anhui service runs about 3,300 kilometers at 1,100 kilovolts and carries 12 GW, the largest single transmission link on earth. State Grid and China Southern Grid together operate roughly 40 UHV lines, with more under construction, and cross-regional transfers cover on the order of a tenth of national consumption.
Yet the backbone has its own absorption limits. Traditional direct-current UHV lines operate best at high, steady loading; they are poor at tracking a resource that surges at noon and vanishes at dusk. Many lines were financed and contracted under long-term interprovincial agreements built around coal plants at the sending end, and receiving provinces have historically preferred dependable deliveries over variable green electrons. The cautionary case is the Qinghai-Henan line, commissioned in late 2020 and designed specifically to carry about 40 TWh a year of renewable electricity. In its first years of operation it carried a fraction of design throughput, as documented by specialist outlet Energy Iceberg and Chinese financial press, because the solar base meant to feed it and the receiving market's appetite did not materialize on the same schedule.
The grid is catching up, but on infrastructure timescales. Grid investment reached a record 608.3 billion yuan in 2024, up about 15 percent year on year per CEC figures, and State Grid signaled spending above 650 billion yuan for 2025. A UHV line takes roughly two years to build but far longer to plan, approve, and pair with sending-end generation and receiving-end contracts. Solar farms take under a year. That asymmetry in construction speed, panels in months, wires in years, is arguably the single most mechanical answer to why capacity keeps outrunning absorption.
Who decides which power plant runs?
Between the panels, the batteries and the wires sits a layer most analyses skip: dispatch, the rules determining whose electricity actually gets used.
On paper, China's Renewable Energy Law gives renewables purchase priority. In practice, dispatch grew up around provincial self-sufficiency and coal. Power has historically moved under annual plans that pre-allocate generation quotas and utilization hours, layered with interprovincial contracts and, in northern winters, a hard physical constraint: combined-heat-and-power coal units must keep generating electricity to supply district heating, forcing renewable output aside on the coldest nights, a dynamic long documented in CEC-adjacent and academic analyses of northeast curtailment.
The reform direction is real. Spot electricity markets now operate or trial in most provinces, and their price signals are exposing the mismatch with unusual honesty. Shandong's spot market has repeatedly printed negative prices during sunny midday hours, meaning generators paid to produce, because the province's solar fleet dumps power into a system that has nowhere to put it. Document 136, issued by the National Development and Reform Commission (NDRC) and NEA on 9 February 2025, pushes all wind and solar into market trading and replaces guaranteed prices with a competitive settlement mechanism capped by provincial auctions. This is the coherent long-run answer: force renewables to earn their place economically and let prices steer batteries and flexible demand toward the midday glut.
It is also what produced June's record and the cliff that followed. Installations collapsed to a small fraction of June's level in the months after the deadline, per NEA monthly data. Developers raced to lock in the old guaranteed-price regime, then paused to see what provincial market rules would pay them. Market reform solved the incentive problem and created a boom-bust problem in the same stroke.
Coal, meanwhile, got its own new job description. From 1 January 2024, a national coal capacity payment mechanism, set by an NDRC and NEA notice in late 2023, began paying plants for availability rather than just energy: initially recovering around 30 percent of benchmark fixed costs, rising to at least 50 percent from 2026. Read that alongside the 200 GW flexibility-retrofit program for the 14th Five-Year Plan, which lowers the minimum stable output of coal units so they can cycle down when renewables surge. The official design is unmistakable: coal is to become the flexible backup to a renewable-led system, paid to stand by.
If coal is losing, why is China still building coal plants?
Here is the genuine complication, and the evidence cuts against simple narratives in both directions.
Coal's utilization hours have been falling for over a decade, from above 5,000 hours in the early 2010s to roughly 4,600 to 4,700 in 2023, with further slippage reported for 2024 as renewables absorbed more daytime load. Falling hours with rising capacity means each plant earns less energy revenue, the classic death-spiral setup in Western markets.
But absolute coal generation has not fallen. Thermal output grew about 1.5 percent in 2024 against total demand growth near 5 percent, because China's electricity consumption is still expanding fast enough to raise every boat. And approvals of new coal plants surged to more than 100 GW a year in 2022 and 2023 before falling to roughly 60 to 70 GW in 2024, per tracking by the Centre for Research on Energy and Clean Air and Global Energy Monitor.
The logic is security, not energy. The 2021 power crisis, when fuel shortages and price mismatches forced cuts across more than twenty provinces, and the August 2022 Sichuan drought, when hydropower output collapsed and major manufacturers idled production lines, scarred planners. Coal plants are now approved the way governments buy insurance: for the evening, the heatwave, the drought year, the moment the records of June and July collide. Each new plant lowers average fleet utilization further while raising the system's claimed ability to survive extremes. Whether that is prudent redundancy or stranded capital in the making is one of the most consequential unresolved questions in global energy finance, and honest analysts can be found on both sides.
The capital ledger reflects the tension. China invested on the order of $800 billion in energy transition in 2024, more than any other economy, per BloombergNEF estimates, while simultaneously funding tens of billions of dollars a year of new coal construction flagged by the IEA in its coal market reporting. Both things are true at once, and the system is designed to make them both true at once.
How do other grids absorb so much more renewable power?
The international comparison clarifies what China is and is not doing wrong. Denmark runs on wind and solar for roughly three-fifths of its electricity. South Australia exceeds two-thirds variable renewables. Germany and Spain each sit around two-fifths, per Ember's datasets. China is under one-fifth with wind and solar combined.
The difference is not geography or engineering talent. Denmark dumps surplus wind into Norwegian hydro reservoirs and re-imports it across a deeply interconnected Nordic market; its domestic grid is a balcony on a continental system. South Australia leans on interconnectors and flexible gas within the Australian market. These are small systems nested inside large balancing areas, with market coupling that prices and trades imbalance across borders in near real time.
China is a continent-sized system operated as semi-autarkic provincial grids inside regional synchronous zones, where provincial governments are graded on keeping their own lights on and their own plants running. It has almost no flexible gas fleet by European standards, a hydro fleet hostage to rainfall, and a coal fleet contracted by the year. The tools that let Denmark absorb wind at 60 percent are institutional as much as technical, and China's institutions are only now being rebuilt for the task.
Do the capacity numbers mislead?
Systematically, yes, and the pattern is worth naming precisely. Installed capacity counts what could run under ideal conditions. It does not count curtailment, hours of darkness, transmission congestion, negative price hours, or the evening peak. Solar capacity in China overstates solar's contribution by roughly a factor of four relative to coal capacity on an energy basis, and by more on a firm-capacity basis.
That does not make the milestone fake. Capital, manufacturing scale, learning curves and political momentum are all real products of the build-out, and the generation share of wind and solar has roughly doubled in four years. But the honest sentence is the narrower one: China's panels have outnumbered its coal plants, not out-generated them, and whether the second crossing happens in a decade depends on institutions and wires more than on modules.
What would it take for the electricity crown to follow?
The watchlist is now concrete. National curtailment rates, and whether they breach the 10 percent tolerance the state quietly wrote into policy. Battery utilization, not battery gigawatts: how many times the fleet actually cycles. The spread between midday and evening power prices in provincial spot markets, the single best real-time gauge of absorption stress. Coal fleet utilization hours, the pressure gauge of the backup model. The throughput and renewable share of new UHV lines. And the provincial implementation rules under Document 136, which will decide whether the post-June installation pause becomes a stall.
The June 2025 record and the July 2025 record describe the same system from two angles. One shows what China can build faster than any nation in history. The other shows what it cannot yet do with what it built. The grid, the market and the evening are now the frontier. The panels were the easy part.
Sources
- National Energy Administration (NEA), national power industry statistical releases for 2023, 2024, and H1 2025 (installed capacity, generation, storage, and monthly installation data). nea.gov.cn
- China Electricity Council (CEC), "Report on National Electricity Supply and Demand Analysis and Forecast, 2024-2025," January 2025, and 2024 power industry statistics (coal capacity and share, utilization hours, generation by source, grid investment). cec.org.cn
- National Bureau of Statistics of China, "Statistical Communiqué on the 2024 National Economic and Social Development," February 2025 (total generation, thermal output, coal production). stats.gov.cn/english
- Reuters, reporting on NEA data: wind and solar combined capacity surpassing coal (August 2024); record June 2025 solar installations of 92.92 GW and H1 2025 total; record national power load of about 1.51 billion kW (July 2025); distributed solar "red zones" (2024). reuters.com/world/china
- State Council of the PRC, "2024-2025 Energy Conservation and Carbon Reduction Action Plan," May 2024 (relaxation of renewable utilization-rate standards in constrained regions). english.www.gov.cn
- NDRC and NEA, "Notice on Deepening Market-Oriented Reform of On-Grid Prices for New Energy" (Document 136), 9 February 2025 (market entry for renewables, settlement mechanism, end of mandatory storage co-location). ndrc.gov.cn
- NDRC and NEA, "Notice on Establishing a Capacity Pricing Mechanism for Coal-Fired Power," November 2023, effective 1 January 2024.
- NDRC and NEA, coal power unit retrofit and upgrade implementation plan, 2021 (200 GW flexibility-retrofit target for the 14th Five-Year Plan).
- NEA, "Medium- and Long-Term Development Plan for Pumped Storage (2021-2035)," September 2021 (62 GW by 2025; 120 GW by 2030).
- S&P Global Commodity Insights, reporting on provincial curtailment and utilization-rate data (2024). spglobal.com/commodityinsights
- International Energy Agency, "Coal 2024: Analysis and Forecast to 2027," December 2024 (China coal demand, capacity and investment trends). iea.org/reports/coal-2024
- International Energy Agency, "Electricity 2025," February 2025 (China generation mix and demand outlook). iea.org/reports/electricity-2025
- Ember, China electricity data and international generation-share comparisons (Denmark, Germany, Spain and other benchmarks). ember-energy.org/countries-and-regions/china
- Centre for Research on Energy and Clean Air (CREA) and Global Energy Monitor, briefing on China's coal power approvals in 2024, February 2025. energyandcleanair.org
- BloombergNEF, "Energy Transition Investment Trends 2025," January 2025 (China energy-transition investment of about $800 billion in 2024). about.bnef.com
- State Grid Corporation of China, project disclosures and annual reporting on UHV transmission, including the Changji-Guquan 1,100 kV line and 2025 investment plans. sgcc.com.cn
- Energy Iceberg and Caixin Global, specialist reporting on Qinghai-Henan UHV line underutilization and low utilization of mandatory co-located battery storage (2021-2024). energyiceberg.com
- Reuters and BBC coverage of China's 2021 power crisis and the August 2022 Sichuan drought-related industrial shutdowns (historical context on supply security).
Comments (3)
Continue exploring
U.S. Grid Cyber Rules Are Finally Catching Up With Virtualized Operations
FERC now lets U.S. grid operators virtualize critical control systems; whether resilience outpaces the new risks depends on…
U.S.-China AI talks could make autonomous cyberattacks a matter of strategic stability
Reuters reports the U.S. and China are preparing a mid-September AI safety dialogue. What it can realistically deliver: an…
What breaks if China stops exporting rare-earth magnets tomorrow
One component, sintered NdFeB magnets, sits inside missiles, fighter jets, EVs, and surgical robots, and China makes over 90% of…
Reading through this, I was struck that the article promises to examine 'storage, transmission, dispatch and market machinery' but the section available focuses almost entirely on capacity factors and curtailment. I might have missed it, but is there a sense of how much grid-scale battery storage China has actually commissioned alongside those 92.92 gigawatts in June, and whether that pace is anywhere near what would be needed to shift solar output into the evening peak? It would help to know whether storage additions are tracking installations or lagging them, since that would clarify whether the duck curve problem is being actively addressed or simply deferred. The way the piece frames the 7pm gap suggests storage is the missing piece, but the numbers aren't in the visible portion.
In my work with utility-scale solar projects in Southeast Asia, I've seen how misleading nameplate figures can be for non-engineers, and we routinely have to explain to stakeholders why a 200 MW facility delivers closer to 30 MW on average. The article's capacity factor range of 14 to 15 percent for Chinese solar matches what we've observed in similar climates, and the capacity credit framing is exactly the language our grid planners use when arguing against one-for-one thermal replacement. What stood out most was the seven-in-the-evening observation; on hot summer days here, our own solar fleet does the same thing, producing near zero precisely when system stress peaks and dispatchable generation matters most.
The article flags that coal's share of generation could be anywhere from the mid-50s to low-60s percent depending on the dataset, which is a wide enough range that the roughly seven-to-one coal-to-solar comparison feels less precise than presented; I'd want to know what the lower-bound estimate actually looks like before drawing firm conclusions.