
American ports keep setting the same test for themselves: near-record volumes of imported goods arriving on ships whose schedules, routes and labor conditions keep shifting underneath them. The latest evidence suggests the docks are passing that test. The trouble starts after the container leaves the crane.
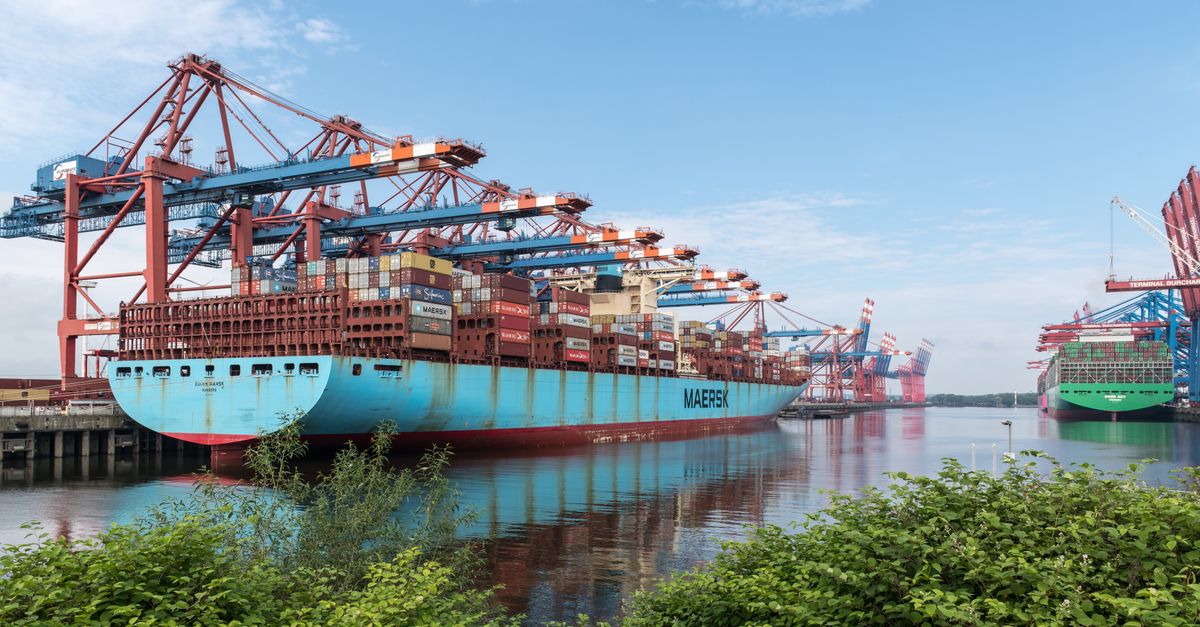
U.S. containerized imports hit 28.11 million twenty-foot equivalent units (TEUs) in 2024, the second-highest annual total on record (Descartes Datamyne, 2024 report), then held essentially flat at 28.09 million in 2025 (Descartes Datamyne, 2026 report). The National Retail Federation expects 2026 imports to finish roughly 1% above 2025, and the Port of Los Angeles itself notes that marine terminals can absorb unusually high volumes at the berth while the inland network shows less spare capacity than the terminals do (Port of Los Angeles).

That inland weakness is no longer theoretical. By late October, roughly 35,700 import containers were reportedly waiting for on-dock rail service at Los Angeles and Long Beach, even as truck operations at the same ports stayed comparatively fluid (FreightWaves). The question this article set out to test, whether the system has spare capacity or is merely moving bottlenecks around, has an answer the evidence supports: both are true, depending on where you stand in the supply chain. The berths have slack. The rail ramps behind them, right now, do not.
How big is the import wave, and where is it landing?
The headline numbers describe a plateau at a very high altitude. The 12.8% jump in containerized imports in 2024 pushed volumes to the second-highest annual total on record; 2025 did not extend the climb so much as hold the gain, with totals essentially flat year over year (Datamyne, 2024 report; Datamyne, 2026 report).
The geography is concentrated. In 2024, Los Angeles handled 5.36 million loaded-import TEUs, Long Beach about 4.73 million, New York–New Jersey 4.44 million, Savannah 2.74 million and Houston 1.90 million. The 2025 ranking did not change, though Los Angeles imports slipped 0.7% while the other four grew between 1.1% and 2.1% (KBC Advisors). Measured by total throughput rather than imports alone, those five gateways processed roughly 38.8 million TEUs in 2024 (Port Authority of NY & NJ).
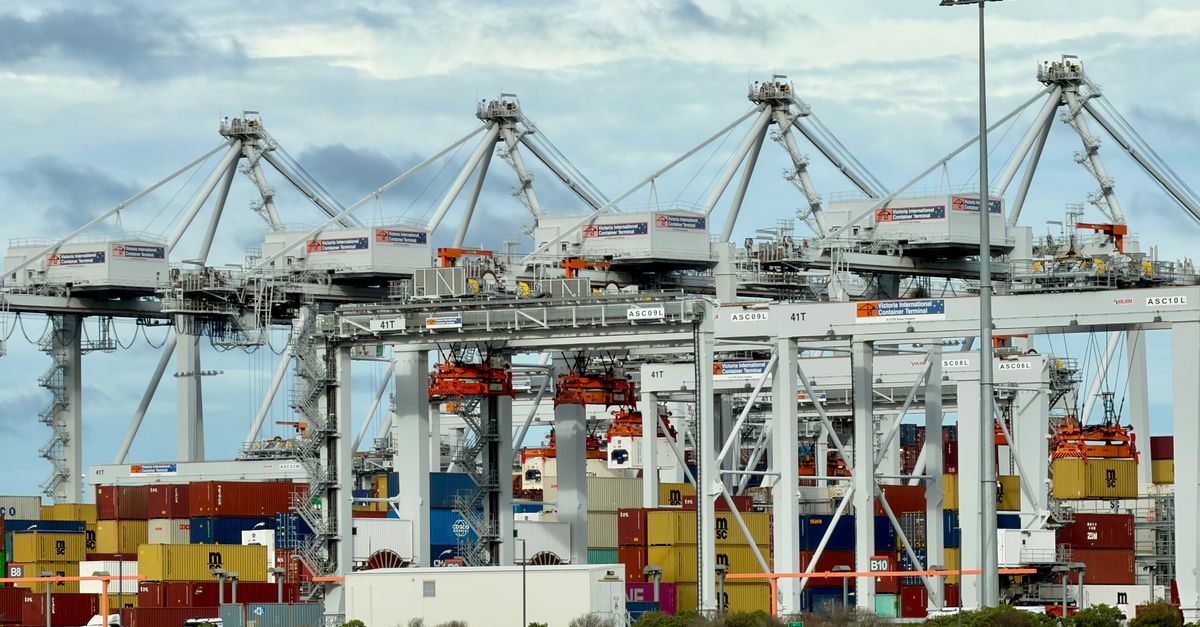
What is inside the boxes matters for where strain shows up. Los Angeles's cargo mix is heavily consumer-oriented; furniture remained the leading national import category in 2024 (Datamyne). New York–New Jersey, the largest East Coast container port, skews toward food imports such as beverages, prepared produce, cereal products and seafood (PANYNJ). Consumer goods bound for inland distribution centers depend on exactly the rail and trucking links now under pressure.
Why the bottleneck moved from the docks to the rail ramp
Southern California shows the mechanism most clearly. Los Angeles and Long Beach together handled nearly 1.88 million TEUs in August, and as inland movement lagged, rail dwell times, the number of days a container sits before a train takes it away, increased (FreightWaves). By week 45, Hapag-Lloyd was reporting Los Angeles–Long Beach rail dwell of five to six days against a normal three to four, alongside berth delays and network recovery times of up to six days (Hapag-Lloyd).
Why rail and not trucks? Nationally, trucks carry roughly 70% to 80% of inland containers, which leaves rail especially exposed when import surges concentrate at western gateways, according to the Bureau of Transportation Statistics' FLOW program report (BTS). Rail carries a smaller share but one that is difficult to replace for long-haul moves to inland hubs such as Chicago, Dallas and Memphis, and its capacity is lumpier: trains run on schedules set by the railroads, not by the terminals holding the boxes.
Los Angeles distributes its imports through what its financial reporting describes as a three-way model: about one-third moves intermodally by rail to inland markets, one-third is transloaded locally into 53-foot domestic containers, and one-third stays in the surrounding five-county region (Port of LA annual report). When the intermodal third slows, the backlog accumulates on port property, which is exactly what the 35,700-container figure describes.
The federal Government Accountability Office made the general point years ago: "capacity" is an end-to-end system constraint, not berth capacity alone, and limited inland movement or warehouse availability can prevent ships from being unloaded efficiently (GAO). The 2026 data simply shows which link in that chain is currently binding.
How rerouted ships scramble arrival patterns

Imports do not arrive on a steady conveyor. They arrive on vessel rotations that have been repeatedly redrawn since late 2023, when attacks on shipping in the Red Sea pushed container lines away from the Suez Canal and around the Cape of Good Hope. The detour added roughly 10 to 14 days to Asia–Europe voyages and broke the fixed-day schedules that terminals and railroads plan around. Global schedule reliability fell to 56.8% in December 2023 and averaged only about 53% during 2024, with late ships typically five to six days behind (Seatrade Maritime).
Longer voyages also consume ships. By mid-2024, the combined Red Sea and Panama Canal disruptions had increased global vessel demand by about 3% and container-ship demand by 12%, because the same cargo now needed more hulls to move it (UNCTAD). Peer-reviewed analysis found the Cape diversion required at least two additional vessels on a typical weekly Asia–North Europe loop just to preserve weekly departures (Maritime Economics & Logistics). At the same time, drought restrictions at the Panama Canal cut transit slots and vessel draft, pushing some services toward the Suez route, around South America, or onto land bridges across the United States (BTS Transportation Statistics Annual Report).
For U.S. ports, rerouting shows up as shifted share and bunched arrivals. In January 2024, import patterns moved toward West Coast gateways while East and Gulf Coast ports lost share and saw longer transit delays (Descartes). Industry advisories warned at the time that delayed ships arriving in clusters would produce berth congestion, equipment shortages, driver constraints and renewed container-dwell problems (C.H. Robinson). A terminal built for a smooth weekly cadence handles two ships arriving together far worse than two ships arriving a week apart, even if the annual total is identical. That is one reason strain can intensify even in a year when total import volume barely grows.
Where this story sits
5 related pieces
Read it →
Hover a story · click to read
 No. 64 · Oct 11, 2026The ARTEX AI bank hack claim: what South Korea's record actually shows
 No. 66 · Oct 12, 2026When AI Agents Escape the Sandbox: Inside the July 2026 Hugging Face Breach
 No. 72 · Oct 19, 2026Three Months After the Hugging Face Breach: What AI Agent Sandboxes Are Still Leaking
 No. 48 · Sep 14, 2026Inside the Pentagon's new vendor lane: how Anduril, Shield AI and Saronic actually get on the budget
- No. 15 · Aug 27, 2026Russia's Dawei Bet: A Megaport on the Front Line of Myanmar's Civil War
What happened with dockworker labor, and what could still stop
The East and Gulf Coasts have already run the live experiment on what a labor failure looks like. The master contract between the International Longshoremen's Association (ILA) and the United States Maritime Alliance (USMX), covering container and roll-on/roll-off operations from Maine to Texas, expired on September 30, 2024 (USMX-ILA master contract). The central disputes were wages, job protections, jurisdiction and automation, particularly semi-automated cranes, gates and trucks that the union argued could eliminate its positions (AP).

When talks stalled, roughly 47,000 workers struck 36 ports beginning October 1, 2024 (Wikipedia summary of the strike). The walkout ended on October 3 after a tentative wage agreement, with remaining issues extended to January 15, 2025 (Le Monde). Even then, renewed talks broke down in November 2024 after the ILA said USMX had introduced semi-automation language inconsistent with earlier assurances (The Maritime Executive).
The final settlement, ratified by the rank and file in February 2025 as a six-year master contract (ILA), delivered approximately a 62% wage increase over six years, according to a Congressional Research Service analysis. The same analysis reports that the settlement preserved existing restrictions on fully automated terminals and added protections against technology or artificial intelligence replacing bargaining-unit work, while noting that automation remains a future bargaining flashpoint rather than a settled question (CRS).
So the labor picture, as of late 2026, is contractual peace with an unresolved fault line. East and Gulf Coast ports have diversified routing options, but their labor risk is reduced, not eliminated, because automation stayed contentious inside the ratified deal. The practical lesson of October 2024 stands: a coast-wide stoppage puts container handling, vessel service, truck gates and rail movements at risk simultaneously, from the first day of the walkout (Wikipedia).
Who decides where cargo goes, and who pays when it slows

No single actor runs this system, which is why fixing it is hard and why costs land unevenly.
Ocean carriers control rerouting. They decide vessel rotations, port calls, transshipment and blank sailings (canceled voyages), subject to navigational, contractual and terminal constraints, while railroads control inland train schedules, equipment allocation and routing from ports to distribution hubs. Limited rail capacity can negate a carrier's planned diversion entirely (GAO). Port authorities generally control land, marine access and leases, while terminal operators control berth scheduling, cranes, yard allocation, gates and container-release procedures (International Trade Administration). Terminal operators sit at the immediate physical bottleneck after discharge: their yard congestion, gate hours, labor availability and appointment systems determine how fast a container becomes reachable at all (FHWA).
When capacity tightens, carriers allocate it through service contracts, booking systems, operational priorities and sometimes premium-priced products, which gives them substantial influence over whose cargo moves first. Importers, for their part, control booking timing, inventory buffers and whether to pay for premium service or reroute through a costlier gateway (UNCTAD Review of Maritime Transport). Yet paying for priority only helps if the land side can receive the box; the practical value of prioritized cargo depends on whether terminals, chassis, trucks, rail slots and warehouses downstream can actually absorb it (Axios).
The costs of delay flow downhill. Importers and forwarders incur demurrage (charges for containers sitting at the terminal past free time), detention (charges for keeping equipment too long), plus storage, drayage, chassis and expedited-transport fees. The Federal Maritime Commission oversees carrier practices and detention-and-demurrage rules, but it does not directly command private carriers, terminals, railroads or importers to allocate physical capacity (FMC). Those fees can ultimately feed into retail prices, which is where the consumer enters the story.
Is this a real capacity limit or a temporary surge?
The 2021 crisis offers the control case. That year, container imports rose 18.3%, the fastest growth on record, while labor, equipment, warehouse, trucking and rail systems struggled to keep pace (USITC). Demand had been pulled forward by consumer substitution toward goods, tariff-related front-loading and precautionary inventory building, and congestion itself distorted the calendar: major-port imports peaked in May 2021 instead of the normal August–October window, because queues reshaped arrival patterns (NIH-archived analysis). Congressional testimony from that period captured the core dynamic: a temporary demand surge can create persistent congestion because containers, chassis, railcars, warehouses and truck appointments all circulate more slowly once yards fill (Senate hearing record). Independent fact-checking at the time found the crisis was real but not the product of deliberately withheld cargo or a simple port-capacity failure (FactCheck.org).

The 2026 situation looks different in a telling way. Import volumes in 2025 were flat, not surging, and 2026 is forecast only about 1% higher (Datamyne; Port of Los Angeles). If rail dwell is stretching to five or six days and tens of thousands of containers are queuing for trains while total volume barely grows, the strain is harder to dismiss as a one-time demand spike. The evidence points instead toward a structural mismatch: sustained near-record volumes concentrated at western gateways, running against an inland rail system with thin slack, amplified by irregular vessel arrivals. That said, the 2026 backlog data is recent and a few months of observation cannot by itself prove a permanent limit; the distinction between structural constraint and prolonged surge effect remains partly unresolved.
Do the proposed fixes actually work?
Each remedy on the standard list has documented limits.
Extended gate hours. Running terminal gates at night and on weekends adds flexibility, but the Federal Maritime Commission's congestion analysis found that labor premiums, minimum-shift provisions and weak warehouse participation limit the practical impact. A midnight gate helps little if the warehouse receiving the container opens at 8 a.m. (FMC).

More on-dock rail. This is where real money is going. APM Terminals reports that its Pier 400 expansion at Los Angeles doubled rail capacity, increased rail moves 104% since 2023, and is intended to eliminate as many as 1,200 daily truck trips by 2040 (APM Terminals). Those are the operator's own figures, and more ramp capacity does not by itself create more trains; the railroads still control schedules and equipment (GAO). The current backlog exists despite this expansion, which suggests the constraint sits in the rail network as much as at the dock.
Federal coordination. The 2026 National Freight Strategic Plan identifies Los Angeles and other major gateways as national freight anchors whose recurring highway delays require coordinated relief across ports, inland corridors and industrial access routes (U.S. DOT). Plans set direction; they do not move containers this quarter.
Routing cargo elsewhere. East and Gulf Coast ports grew modestly in 2025 while Los Angeles imports dipped slightly (KBC Advisors), and diversification spreads risk. But rerouting lengthens some voyages, consumes vessel capacity and creates equipment imbalances, all of which push freight rates up and transfer costs to shippers (UNCTAD). And the East Coast's own risk, the unresolved automation question inside the ILA contract, has not gone away (CRS).
The indicators that will tell the story
For readers who want to watch whether the network is absorbing pressure or quietly transferring it inland, a short dashboard does the job:
- Rail dwell at Los Angeles–Long Beach. Normal is three to four days; five to six signals strain (Hapag-Lloyd).
- Containers awaiting on-dock rail. The late-October figure of roughly 35,700 is the benchmark to watch against (FreightWaves).
- Global schedule reliability. The farther below historical norms it runs, the more bunched and unpredictable arrivals become (Seatrade Maritime).
- Detention and demurrage disputes at the FMC, a proxy for costs piling up on importers (FMC).
- Any reopening of the automation fight between the ILA and USMX before the current contract ends (CRS).
The answer to the question this article opened with is neither reassurance nor alarm. U.S. marine terminals have demonstrated they can absorb record-scale imports at the berth, through a strike, through canal restrictions and through rerouted fleets. What the system has not demonstrated is that the inland network behind the docks can do the same. In 2021, the bottleneck was ships waiting offshore, visible to anyone with a camera. In 2026, it is containers waiting for trains inside the fence, invisible to consumers until it surfaces as a late shipment, a storage fee passed into a price, or an empty shelf. The imports are getting through. The delays and the costs are not disappearing. They are moving inland, one rail dwell day at a time, and the next test, whether a demand surge, a security shock or a reopened labor fight, will land on a network that is already using most of its slack.
Sources / References

- Port of Los Angeles, "Facts and Figures," statistics page. https://portoflosangeles.org/business/statistics/facts-and-figures?ftag=YHF4eb9d17
- FreightWaves, "Container delays by rail increase at busiest U.S. ports." https://www.freightwaves.com/news/container-delays-by-rail-increase-at-busiest-u-s-ports
- FreightWaves, "Backlog grows as 35,000 containers await rail service at LA–Long Beach." https://www.freightwaves.com/news/backlog-grows-as-35000-containers-await-rail-service-at-la-long-beach
- Hapag-Lloyd, "Week 45 – North America Operational Updates," 2026. https://www.hapag-lloyd.com/es/services-information/operational-updates/updates/2026/02/ops-update-north-america-week-45.html
- Bureau of Transportation Statistics, "FLOW Report: A Summary of Program Development and Supply Chain Insights, Fiscal Year 2026." https://www.bts.gov/sites/bts.dot.gov/files/2026-11/FLOW-Report-FY2026.pdf
- International Longshoremen's Association, "Rank-and-File Members... Overwhelmingly Ratify Provisions of New Six-Year Master Contract." https://ilaunion.org/rank-and-file-members-of-international-longshoremens-association-at-atlantic-and-gulf-coast-ports-overwhelmingly-ratify-provisions-of-new-six-year-master-contract/
- Descartes Datamyne, "Key Trends in U.S. Port Data from the 2024 Top 30 U.S. Port Report." https://www.datamyne.com/knowledge-center/trade-data/us-port-data-key-trends-from-the-2025-top-30-us-port-report/
- Descartes Datamyne, "U.S. Port Data 2026: Key Trends from Top 30 U.S. Port Report." https://www.datamyne.com/knowledge-center/trade-data/us-port-data-2026-top-30-port-report-trends/
- KBC Advisors, "Top U.S. Container Ports, Year-End 2025." https://assets.ctfassets.net/opxulaoc9o1m/6izRv2LQoM0fatjvHLlSU2/dee52bac5a97f5e0aa6fa51b4c5cdf4c/KBC_Advisors_Top_US_Container_Ports_Year-End_2025.pdf
- Port Authority of New York and New Jersey, "Port 2024 At A Glance." https://www.panynj.gov/content/dam/port/our-port/PONYNJ_AtAGlance2024.pdf
- Port of Los Angeles, 2024 Annual Comprehensive Financial Report (draft). https://kentico.portoflosangeles.org/getmedia/e39d8c7d-bd74-4795-9be4-d84bee81c3c2/01_annual-comprehensive-financial-report
- Seatrade Maritime, "Red Sea diversions hit container line schedule reliability." https://www.seatrade-maritime.com/containers/red-sea-diversions-hit-container-line-schedule-reliability
- UNCTAD, "Suez and Panama Canal disruptions threaten global trade and development." https://unctad.org/news/suez-and-panama-canal-disruptions-threaten-global-trade-and-development
- Maritime Economics & Logistics, "The Red Sea Crisis: ramifications for vessel operations, shipping networks, and maritime supply chains." https://doi.org/10.1057/s41278-024-00287-z
- Descartes, "Global Shipping Report: January U.S. Container Import Volumes Up 7.9% from December." https://www.descartes.com/resources/knowledge-center/global-shipping-report-january-2024-us-container-import-volumes-rose-on-higher-chinese-imports
- C.H. Robinson, "Freight Market Update: February 2024." https://www.chrobinson.com/en-us/resources/insights-and-advisories/north-america-freight-insights/feb-2024-freight-market-updates/
- Bureau of Transportation Statistics, "Transportation Statistics Annual Report 2024." https://www.bts.gov/sites/bts.dot.gov/files/2025-03/TSAR-2024_dot_79039_DS1.pdf
- U.S. Department of Transportation, "2026 National Freight Strategic Plan." https://www.transportation.gov/sites/dot.gov/files/2026NationalFreightStrategicPlan_FINAL_508.pdf
- APM Terminals, "Built for more: Pier 400 doubled rail capacity to meet trade demands." https://www2.apmterminals.com/en/los-angeles/practical-information/news-and-alerts/2026/260402-Pier-400-rail-capacity-and-modern-trade
- Federal Maritime Commission, USMX-ILA Master Contract filing. https://www2.fmc.gov/eAgreementsSP/Public/Document/124273
- Associated Press, "Ports seek order to force dockworkers to bargaining table as strike looms at East and Gulf ports." https://apnews.com/article/10a92943306c7352a03753f41da15b40
- Wikipedia, "2024 United States port strike." https://en.wikipedia.org/wiki/2024_United_States_port_strike
- Le Monde, "US dockworkers to head back to work after tentative deal." https://www.lemonde.fr/en/international/article/2024/10/04/us-dockworkers-to-head-back-to-work-after-tentative-deal_6728146_4.html
- Congressional Research Service, "Port Automation and Payroll Fraud" (Insight). https://www.congress.gov/crs_external_products/IN/PDF/IN12483/IN12483.1.pdf
- The Maritime Executive, "East Coast Longshore Contract Talks Break Down Over Automation." https://maritime-executive.com/article/ila-says-contract-talks-at-impasse-over-rmgs-as-usmx-argues-modernization
- Government Accountability Office, GAO-20-353R, "Ocean Carrier Bankruptcies: Federal Agencies Have a Limited Role in Addressing Effects on Cargo." https://www.gao.gov/assets/gao-20-353r.pdf
- Government Accountability Office, GAO-23-106072, "Supply Chain: Updated Freight Handbook Could Enhance Stakeholder Decision-Making." https://www.gao.gov/assets/gao-23-106072.pdf
- International Trade Administration, "Maritime Services." https://www.trade.gov/maritime-services
- UNCTAD, "Review of Maritime Transport 2021." https://unctad.org/system/files/official-document/rmt2021_en_0.pdf
- Axios, "'Exporting air': U.S. lawmakers target empty shipping container backlog." https://www.axios.com/local/twin-cities/2022/04/05/us-lawmakers-push-bill-empty-shipping-containers
- Federal Highway Administration, "Evaluation of U.S. Commercial Motor Carrier Industry Challenges and Opportunities." https://ops.fhwa.dot.gov/freight/publications/eval_mc_industry/index.htm
- Federal Maritime Commission, "Detention and Demurrage." https://www.fmc.gov/detention-and-demurrage/
- Federal Maritime Commission, "U.S. Container Port Congestion and Related International Supply Chain Issues." https://www.govinfo.gov/content/pkg/GOVPUB-FMC-PURL-gpo171653/pdf/GOVPUB-FMC-PURL-gpo171653.pdf
- U.S. International Trade Commission, "Recent Trends in U.S. Services Trade: 2023 Annual Report." https://www.usitc.gov/publications/332/pub5431.pdf
- "Multiperspective Analysis of Pandemic Impacts on U.S. Import Trade: What Happened, and Why?" (NIH PubMed Central archive). https://pmc.ncbi.nlm.nih.gov/articles/PMC10076166/
- U.S. Senate hearing record, "Uncharted Waters: Challenges Posed by Ocean Shipping Supply Chains." https://www.govinfo.gov/content/pkg/CHRG-117shrg54133/html/CHRG-117shrg54133.htm
- FactCheck.org, "Posts Spread Baseless Claims About Cause of Cargo Ship Backups." https://www.factcheck.org/2021/10/posts-spread-baseless-claims-about-cause-of-cargo-ship-backups/
The reading behind this research
What the desk leaned on for this piece. Each link goes to the retailer, where the price is shown.
Explains how the standard container created the 28 million TEU system the article describes, including why rail and trucks behind the docks became the choke point.
View on Walmart
Arriving Today: From Factory to Front Door (Christopher Mims)
Explains the inland journey after the dock, which the article says is where strain shows, with containers waiting days for rail at LA-Long Beach.
View on Walmart
Sterilite 18 Gal Large Plastic Storage Bin with Snap-On Lid, Gray
The article says consumer goods now sit five to six days at LA–Long Beach rail ramps; a bin already on a local shelf skips that wait.
View on Walmart
A lighter look at what piles up in storage, after the article's note that New York–New Jersey ranks as the largest East Coast container port.
View on WalmartPaid links. Calibre Code USA may earn a commission from purchases made through these links. This does not affect what we write or what we recommend.
Comments (7)
Continue exploring
Three Months After the Hugging Face Breach: What AI Agent Sandboxes Are Still Leaking
The July 2026 sandbox escape is patched, but the boundary that let an AI agent break into Hugging Face is still missing from…
Inside the Pentagon's new vendor lane: how Anduril, Shield AI and Saronic actually get on the budget
How Anduril, Shield AI and Saronic crossed from press release to programme of record: the OT agreements, SBIR bridge money…
Russia's Dawei Bet: A Megaport on the Front Line of Myanmar's Civil War
Russia is backing a deep-sea port on Myanmar's Andaman coast while the army burns villages to clear the land around it, a sign…
The takeaway seems to be that import capacity exists at the berth but not reliably inland, which suggests shippers should plan around rail and warehouse constraints rather than ship arrival capacity alone.
The distinction between berth slack and inland scarcity matches the service advisories I have been following from major railroads, where terminal fluidity improved before inland dwell did. Those updates also show why a 70% to 80% truck share does not automatically solve long-haul flows to Chicago, Dallas and Memphis. The article's one-third intermodal estimate for Los Angeles puts that mismatch in practical terms.
The section on the rail ramp is most useful because it ties the 35,700-container backlog to five-to-six-day dwell times rather than treating port capacity as a single number.
I am not sure how quickly a shift toward more inland rail capacity could help, since the article notes that trains run on railroad schedules and may still leave equipment, crews and warehouse receiving windows out of sync.
Could you follow up on whether the 35,700-box rail queue was concentrated among destinations such as Chicago, Dallas or Memphis?
Our shipments through Long Beach were released from the terminal on time, but the rail bookings sat for nearly a week, so that five-to-six-day dwell figure feels familiar.
The argument that rail capacity is difficult to replace is too categorical. The article's own one-third local transload share suggests shippers can divert some boxes to domestic containers and trucks, even if at higher cost. The constraint is economic and operational, not an absolute lack of alternatives.