
In the Federal Reserve's most recent survey of American households, published in 2026 and covering 2025, 12 percent of adults said they could not cover an unexpected $400 expense by any means at all. Not with cash, not with a card, not by borrowing from family, not by selling something. Another 18 percent said the largest emergency expense they could handle using only their savings was under $100 (Federal Reserve, 2026). That is tens of millions of people for whom "the money ran out" is not a theoretical exercise. It is the current state of their finances.
Now consider what the machine that mediates American life offers those people. Type "what to do when you have no money" into a search engine and the results are telling. One of the top guides, published in August 2026, was written not by a government agency or a nonprofit but by Gerald, a financial app that sells short-term credit. Its advice is the standard survival script: call 211, find a food bank, negotiate with creditors. But woven into it is a pivot: "If you need quick access to funds, an instant cash advance app can help bridge a gap" (Gerald, Aug. 28, 2026). The author of the survival guide is the vendor.

That juxtaposition captures the finding that runs through the evidence on financial collapse in the United States. Hitting zero does not end a person's relationship with the financial system. It changes which part of the system they deal with. The formal safety net (SNAP, TANF, LIHEAP, unemployment insurance, Medicaid, food banks, shelters) catches some people, partially, with strict eligibility gates. For everyone the net misses, a parallel industry stands ready, and it prices its services for people with nothing left. What follows is the documented map of both systems: what actually happens when the money runs out, who it happens to, and what the evidence says about whether "rock bottom" exists at all.
Where zero actually begins
The path to zero almost never starts with extravagance. When researchers ask people filing for bankruptcy or reporting financial hardship what happened, the most common initiating shock is lost income: a layoff, a cut in hours, a business that stopped paying. Illness runs second and usually arrives intertwined with the first, because in the United States losing health often means losing the job and then, a moment later, the bills.
The first systems people encounter are the ones attached to employment itself, and they are thin. Unemployment insurance, created by the 1935 Social Security Act, is the country's oldest wage-replacement program for the jobless, but in recent years only about one unemployed worker in four has actually received benefits in a typical period, with recipiency varying enormously by state, and the average benefit replaces roughly 40 percent of prior wages (Center on Budget and Policy Priorities, Policy Basics: Unemployment Insurance). Volatile earnings make the fall faster. The U.S. Financial Diaries project, which tracked the week-by-week cash flows of 235 low- and moderate-income households, found that income routinely swung by double-digit percentages month to month, with spikes and dips far larger than annual averages suggest (U.S. Financial Diaries). Families budgeting around a "normal" month are budgeting around a fiction.
Then there is the medical route, which deserves precision because the claims around it are often overstated. An American Medical Association council report in 2024 estimated that roughly 100 million people in the United States, 41 percent of adults, carry some debt related to unpaid medical bills, totaling between $195 billion and $220 billion; a 2021 Census Bureau analysis it cites estimated that 15 percent of households owed medical debt, and the Consumer Financial Protection Bureau estimated $88 billion of it sat on Americans' credit reports (AMA Council on Medical Service, Report 5-A-24). The same report repeats a widely quoted line, that medical debt is the leading cause of bankruptcy.
That line is contested, and the dispute matters. A landmark national study by David Himmelstein, Deborah Thorne, Elizabeth Warren, and Steffie Woolhandler surveyed bankruptcy filers in 2007 and classified 62.1 percent of bankruptcies as "medical," based on debtors' stated reasons, lost income due to illness, and the size of medical debts. Notably, three quarters of those medical debtors had health insurance (Himmelstein et al., American Journal of Medicine, 2009). A follow-up study found 66.5 percent of filers cited medical contributors, an estimated 530,000 families a year (Himmelstein et al., American Journal of Public Health, 2019). But economists Carlos Dobkin, Amy Finkelstein, Raymond Kluender, and Matthew Notowidigdo, using hospital admissions data linked to credit reports, estimated that hospitalizations cause only about 4 percent of bankruptcies among nonelderly adults, arguing that "medical bankruptcy" figures rest on how you define the term (Dobkin et al., New England Journal of Medicine, 2018). The honest summary: illness is deeply woven into American financial collapse, through bills, lost work, and caregiving, but no method pins down a single share, and the most-cited numbers depend on generous definitions.
Who the safety net actually catches
Once the money is gone, the sequence of needs is brutally ordered: food, shelter, utilities, then everything else. The formal net is real, and it is fastest at the top of that list.
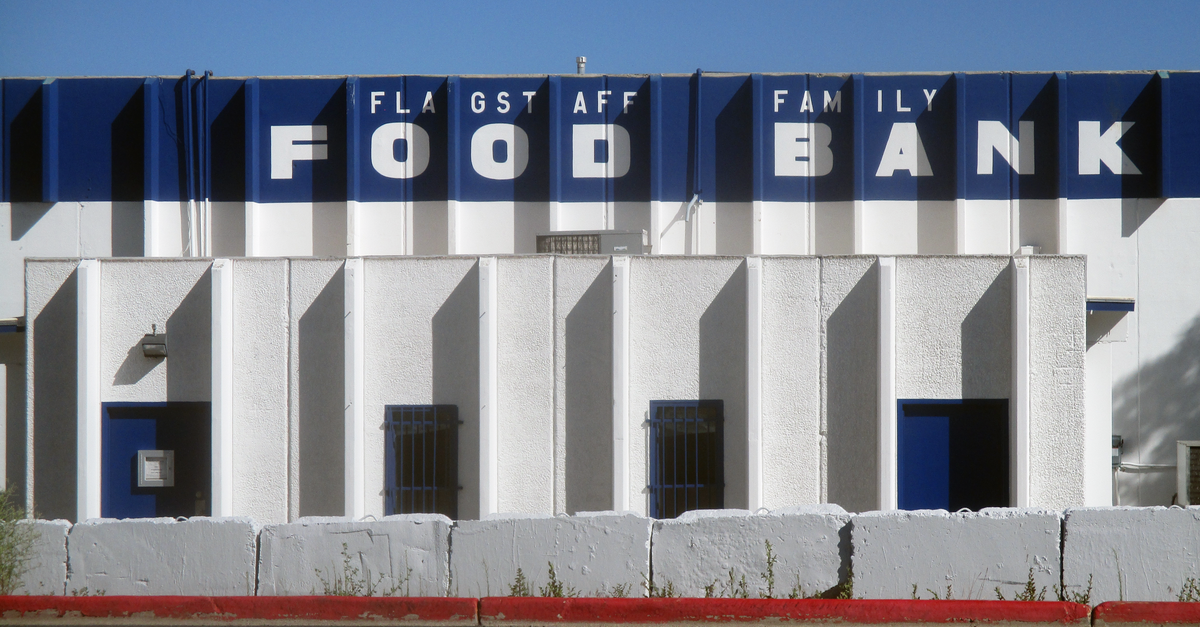
Food assistance is the deepest part of the system. SNAP served about 42 million people in an average month in recent years, with benefits averaging roughly six to seven dollars per person per day (CBPP, Policy Basics: SNAP). Federal regulation requires states to provide "expedited" benefits within seven days for households with under $150 in monthly gross income and under $100 in liquid resources (7 C.F.R. § 273.2). When SNAP is not enough, the charitable tier fills in: Feeding America's Map the Meal Gap study estimated 47 million people, including 14 million children, lived in food-insecure households in 2023 (Feeding America). The Department of Agriculture's own survey found 13.5 percent of U.S. households, about 18 million, were food insecure at some point during 2023, up from 12.8 percent in 2022 (USDA Economic Research Service). In 2025 the department announced it would discontinue that annual survey, which for three decades was the country's principal national measure of hunger (Associated Press, September 2025).

Cash is the shallowest part. Temporary Assistance for Needy Families, the program created when Congress "ended welfare as we know it" in 1996, has been shrinking in real terms ever since. Its block grant has been frozen at $16.5 billion a year since creation, eroding nearly half its value to inflation, and by the early 2020s the program delivered cash assistance to only about 21 families for every 100 families with children in poverty, down from 68 of 100 in 1996 (CBPP, TANF Reaching Few Poor Families). Maximum benefits for a family of three run from under $300 a month in some states to several times that in others (CBPP, Policy Basics: TANF; Urban Institute, Welfare Rules Database). For disabled adults, Supplemental Security Income is the backstop, and its design reveals the system's logic plainly: to keep eligibility, an individual's countable assets must stay below $2,000, a limit unchanged since 1989 (Social Security Administration). The program does not just pay people at the bottom. It requires them to stay there.
Utilities and healthcare sit between. The Low Income Home Energy Assistance Program helps about six million households a year, roughly one in five of those eligible by the program's own accounting, and is the main thing standing between a broken budget and a winter shutoff (Administration for Children and Families, LIHEAP). For medical care, community health centers provided care to a record 31.5 million patients in 2023, about one person in eleven nationally, many on sliding-scale fees that fall to near zero at zero income (HRSA, Bureau of Primary Health Care). Emergency departments must stabilize patients regardless of ability to pay under the 1986 EMTALA statute, which is why the emergency room functions as the true insurer of last resort. And threading through all of it is 211, the referral line run in most of the country by local United Ways, which has become the de facto switchboard routing people at zero toward whatever their county happens to offer (211).
The cliff problem

The distinguishing feature of the American safety net is not its generosity but its gates.
Eligibility cliffs operate in two directions. Going down in income, you can fall through gaps: adults in the ten states that as of 2025 had not adopted the Affordable Care Act's Medicaid expansion can earn too little to qualify for marketplace subsidies and still be ineligible for Medicaid itself (KFF, Status of State Medicaid Expansion Decisions). Going up, you can climb off a cliff: because food, health, childcare, and housing benefits phase out on different schedules, the Congressional Budget Office has documented combined phase-out rates for low-income workers that in some scenarios exceed 60 to 80 cents lost per dollar earned, and can approach or exceed a full 100 percent at specific earnings levels (CBO, Effective Marginal Tax Rates for Low- and Moderate-Income Workers, 2015). A raise of $1 can cost more than $1 in lost benefits.
Asset tests operate as a second gate. SNAP's federal limits have been waived by most states, but TANF asset limits run from $1,000 in some states to $10,000 or more in others that have not eliminated them, SSI's $2,000 limit remains federal law, and general assistance programs in the states that still run them often require applicants to be functionally destitute (Urban Institute, Welfare Rules Database). The mechanism has a perverse consequence: programs designed to catch people at zero frequently require them to spend down to zero first, and to document it repeatedly. The result, borne out in the enrollment data, is that the net catches people best on food, partially on healthcare, and barely at all on cash.
Where this story sits
5 related pieces

Hover a story · click to read
 No. 3 · Aug 25, 2026When the Money Runs Out: The Economics of the Breaking Point
 No. 75 · Oct 21, 2026Are Banks Hiding Security Risks That Could Put Your Money at Risk? Inside the ARTEX Breach
 No. 43 · Sep 8, 2026Mamdani's 9/11 Records Release: What New York Officials Knew About Ground Zero's Toxic Air
 No. 23 · Sep 1, 2026Inside India's Plan to Let AI Agents Spend Money on UPI
 No. 46 · Sep 13, 2026Could a "Rogue AI" Cyberattack Push America Onto Stablecoin Rails?
Where the broke become customers
Whatever the formal net does not cover becomes a market, and the market is organized around one fact: people at zero cannot wait.
The economics are visible in the fee structures. Check-cashing outlets typically take a few percent of every check. Payday loans, the industry's core product, usually cost about $15 per $100 borrowed for roughly two weeks, an annualized rate near 400 percent, and the CFPB found that 80 percent of such loans were rolled over or followed by another loan within 14 days, with half of all loans belonging to sequences at least ten loans long (CFPB, Data Point: Payday Lending, 2014). The median payday borrower does not use the product once and move on. The product's profit model assumes they cannot. Roughly a third of states have now banned high-cost payday storefronts or capped rates near 36 percent, a patchwork tracked by the National Consumer Law Center, which means the trap's availability is a matter of state law, not need (NCLC). Single-payment car-title loans carry similar economics with a harder edge: CFPB research found that about one in five borrowers in its sample had their vehicle seized by the lender (CFPB, Single-Payment Vehicle Title Lending, 2016). The repossessed car then removes the ability to get to work, converting a liquidity problem into an income problem.
Mainstream banking participates. Overdraft and insufficient-funds fees generated $15.5 billion for banks in 2019, concentrated among a small population of account holders with chronically low balances (CFPB, 2021). Several large banks cut or eliminated the fees under sustained regulatory pressure in 2021 and 2022, and overdraft revenue dropped sharply. The CFPB then finalized a rule in December 2024 capping most large-bank overdraft fees, and Congress repealed that rule months later, in spring 2025, using the Congressional Review Act (CFPB, Dec. 12, 2024; Congress.gov, S.J.Res. 18, 119th Congress). The fees remain lower than their peak and entirely legal.

The newest layer is the one that answered the search query at the start of this article. Cash-advance and earned-wage-access apps market "interest-free" advances repaid on payday, monetized through expedite fees and voluntary tips that function as finance charges. The CFPB moved in 2024 to treat many such advances as credit covered by truth-in-lending rules, then withdrew that interpretation in 2025 under new leadership (CFPB interpretive rule, 89 Fed. Reg. 61388, July 31, 2024; withdrawn May 2025). The Gerald survival guide is best understood not as advice but as customer acquisition at the exact moment of maximum need.
None of this works without a customer base, and the customer base is large and patterned. The FDIC's 2023 national survey found 4.2 percent of U.S. households, about 5.6 million, had no bank account at all, and another 14.2 percent were "underbanked," holding an account while still relying on nonbank credit and financial services. Unbanked rates run several times higher among Black and Hispanic households, households with disabilities, and low-income households than among white and higher-income households; the most commonly cited reasons involve minimum-balance requirements, fees, and distrust (FDIC, National Survey of Unbanked and Underbanked Households). The deeper stratifier is the buffer itself. The Federal Reserve's 2022 Survey of Consumer Finances measured median family net worth at about $285,000 for white families, $44,900 for Black families, and $61,600 for Hispanic families (Federal Reserve). "Zero" is not evenly distributed in America. It is the predictable endpoint of starting near zero.
What happens when the debts come due
A person whose account is at zero rarely owes zero. They usually owe more than ever, and that is where a third system takes over: the civil courts.
Debt collection has quietly become one of the largest uses of the American judiciary. Research by The Pew Charitable Trusts found that debt-collection suits grew from about one in nine civil cases in the early 1990s to about one in four by 2013, that fewer than 10 percent of defendants in these suits have legal representation, that the sued party almost always loses, usually by default judgment, and that the judgment then authorizes the machinery of collection (Pew, 2020). Federal law permits garnishment of up to 25 percent of disposable earnings for ordinary consumer debts, more for support orders and taxes, though some states protect more (U.S. Department of Labor, Fact Sheet 30).
Medical debt is the dominant category in the pipeline, and its reporting status has swung with national politics. The CFPB finalized a rule in January 2025 that would have removed medical debt from credit reports; industry groups sued, the agency under new leadership stopped defending its own rule, and a federal judge in Texas vacated it in July 2025, leaving a patchwork of state laws in some states and the status quo in the rest.
The one legal mechanism built specifically for people at zero, bankruptcy, has its own admission price. The court filing fee for a Chapter 7 case is currently $338, before attorney fees that typically run well over $1,000 (U.S. Courts). Researchers who study filers found that about two-thirds report struggling with their debts for two years or more before filing, a period they call "the sweatbox," worn down by collections before finally buying relief (Foohey, Lawless, Porter, and Thorne, "Life in the Sweatbox," Notre Dame Law Review, 2018). Fresh starts exist. They are purchased.
When the last unpaid bill is the rent

Housing is where the cascade lands hardest, because nearly every downstream system assumes an address.
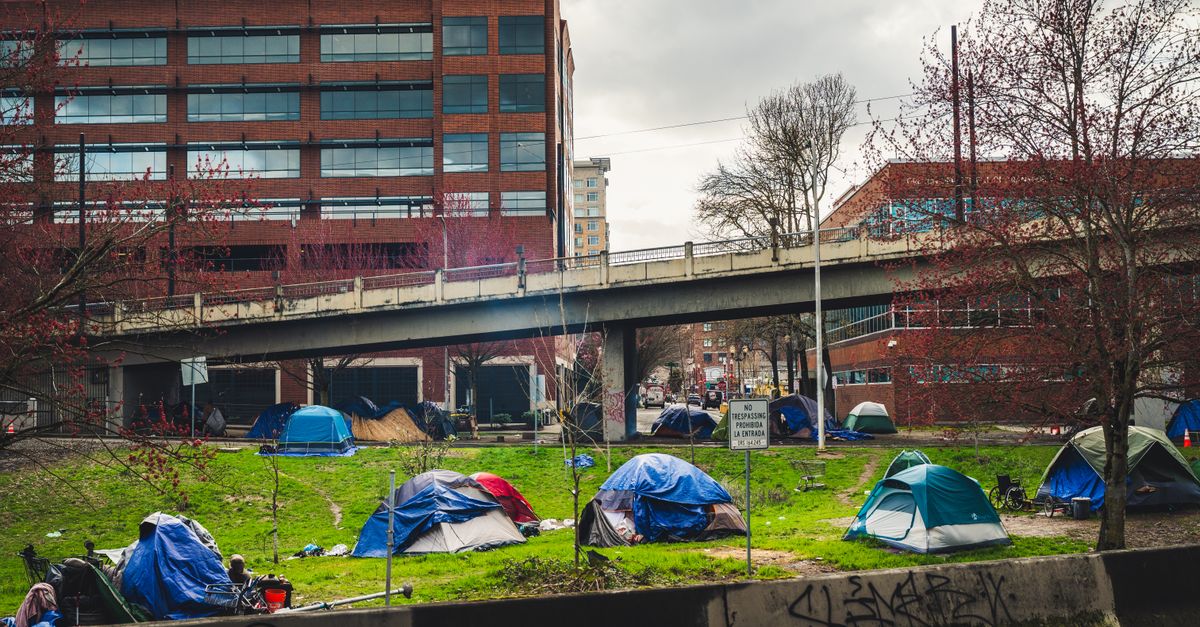
In a typical year, landlords file roughly 3.6 million eviction cases in the United States, according to Princeton's Eviction Lab, whose research has also documented the feedback loop: eviction increases the risk of job loss, depression, and subsequent homelessness, which is to say eviction functions as both a consequence and a cause of arriving at zero (Eviction Lab). The Department of Housing and Urban Development's January 2024 point-in-time count found about 771,000 people experiencing homelessness on a single night, up 18 percent from the year before and the highest figure since the national count began; roughly two-thirds were in shelters or transitional programs, one-third unsheltered (HUD, Annual Homeless Assessment Report).
The shelter system itself operates as a waiting list with rules. Entry commonly requires proving literal homelessness, so the enormous population doubled up with relatives or acquaintances, which HUD's point-in-time methodology does not count, sits in a statistical blind spot. Shelter capacity in large cities and warm-weather states runs chronically short; rural regions often have no emergency shelter at all within a day's drive, substituting church halls, motel voucher programs, and informal networks. The path from shelter to street is not a single event but a sorting: those with a family connection, a voucher, or a new income exit in weeks or months; those without cycle through shelters, doubling-up, and eventually encampments, where the absence of an address then blocks benefit applications and job offers alike. Healthcare collapses in parallel. In the Medicaid holdout states, which are concentrated in the South, the uninsured at zero face the emergency room as their only guaranteed access point, and federal law only obligates hospitals to stabilize, not to treat.
How long the climb back takes
Recovery is possible. It is also slow, and the data say how slow.
Workers displaced by mass layoffs suffer earnings losses that persist for years; the foundational study in this literature, drawing on administrative data from Pennsylvania, found average losses of roughly 25 percent even six years after displacement (Jacobson, LaLonde, and Sullivan, American Economic Review, 1993). Rebuilding a buffer is slower still. In the Fed's 2025 survey, 55 percent of adults said they had rainy-day savings covering three months of expenses, down from 59 percent in 2021, and among people who never have money left over at the end of the month, only 13 percent had such a fund (Federal Reserve, 2026). The credit dimension outlasts the financial one: most negative marks persist on credit reports for up to seven years under the Fair Credit Reporting Act, and a bankruptcy for up to ten, affecting rents, insurance rates, and in some states hiring.
Some groups face the climb with additional weight. Roughly 27 percent of formerly incarcerated people were unemployed in the most recent systematic estimate, a rate the Prison Policy Initiative notes exceeds the national unemployment peak even during the Great Depression, and their exclusion from licensed work and public housing locks in the effect (Prison Policy Initiative). Older displaced workers often never return to prior earnings. For disabled workers inside the SSI asset cap, the system prohibits the recovery itself: saving $2,001 can end eligibility.
Does "rock bottom" actually exist?
The phrase implies a floor: a point where things stop getting worse and begin, obligingly, to improve. The research record suggests the image is wrong in two ways.
First, exposure to zero is not a rare catastrophe that descends on the reckless. It is a common, recurring condition. The Financial Diaries households cycled through lean months many times a year; the Fed's surveys find a large, largely stable minority of adults who could not survive a $400 shock in any given year; poverty measures show people moving into and out of poverty continuously. For a substantial share of the population, "money ran out" is not a chapter in a biography. It is a month in most years.

Second, where the floor sits is a policy setting, not physics. The United States demonstrated this directly. When the expanded Child Tax Credit was in effect in 2021, the child poverty rate under the Census Bureau's Supplemental Poverty Measure fell to 5.2 percent, the lowest ever recorded; when the expansion expired at the end of that year, the rate more than doubled, to 12.4 percent in 2022 (U.S. Census Bureau, Poverty in the United States: 2022). No behavior changed. The floor moved, and several million children moved with it.
The direction as of this writing is down. The budget law enacted in July 2025, sometimes called the One Big Beautiful Bill Act, extended work-reporting requirements in SNAP to adults up to age 64 and to parents of children 14 and older, and for the first time will require states to pay part of SNAP benefit costs, beginning in fiscal 2028, under a formula tied to error rates. The Congressional Budget Office projected that the law's health provisions would leave roughly 10 million more people uninsured by 2034 (CBO, estimated budgetary effects of P.L. 119-21). The federal government has simultaneously moved to retire the annual survey that measured hunger, repeal the overdraft fee cap, abandon the medical-debt credit-reporting rule in court, and pull back the CFPB's supervision of nonbank lenders. Safety nets are being narrowed at the same time the instruments that measure need are being switched off.
Which returns to the search results. When someone's money runs out today, the formal system answers with a seven-day expedited application, a $2,000 asset limit, a six-dollar-a-day food benefit, and a cash program that now reaches one family in five. The parallel system answers instantly, with an app, at 400 percent annualized. The honest answer to "now what?" is that the question has already been answered for you, by whichever system reaches you first. The evidence assembled here points to one conclusion, and it is not a comforting one: in America, zero is not the end of your financial life. It is the beginning of your most expensive one.
Sources / References
- Federal Reserve, "Report on the Economic Well-Being of U.S. Households in 2025: Savings and Investments" (2026). https://www.federalreserve.gov/publications/2026-economic-well-being-of-us-households-in-2025-savings-investments.htm
- Gerald Financial Team, "What to Do When You Have No Money" (Aug. 28, 2026). https://joingerald.com/learn/financial-wellness/what-to-do-when-you-have-no-money
- American Medical Association, Council on Medical Service, "Patient Medical Debt," Report 5-A-24 (2024). https://councilreports.ama-assn.org/councilreports/downloadreport?uri=%2Fcouncilreports%2Fa24_cms_rpt_5.pdf
- Himmelstein, Thorne, Warren, and Woolhandler, "Medical Bankruptcy in the United States, 2007: Results of a National Study," American Journal of Medicine (2009). https://www.kff.org/wp-content/uploads/sites/2/2010/01/bankruptcy-2009.pdf
- Himmelstein, Lawless, Thorne, Foohey, and Woolhandler, "Medical Bankruptcy: Still Common Despite the Affordable Care Act," American Journal of Public Health (2019). https://pmc.ncbi.nlm.nih.gov/articles/PMC6366487/
- Dobkin, Finkelstein, Kluender, and Notowidigdo, "Myth and Measurement: The Case of Medical Bankruptcies," New England Journal of Medicine (2018). https://doi.org/10.1056/NEJMp1716604
- Center on Budget and Policy Priorities, "Policy Basics: Unemployment Insurance." https://www.cbpp.org/research/economy/policy-basics-unemployment-insurance
- U.S. Financial Diaries (Morduch and Schneider), household cash-flow research. https://www.usfinancialdiaries.org/
- Center on Budget and Policy Priorities, "Policy Basics: The Supplemental Nutrition Assistance Program (SNAP)." https://www.cbpp.org/research/policy-basics-the-supplemental-nutrition-assistance-program-snap
- Electronic Code of Federal Regulations, 7 C.F.R. § 273.2 (SNAP eligibility and expedited service). https://www.ecfr.gov/current/title-7/section-273.2
- Feeding America, Map the Meal Gap. https://map.feedingamerica.org/
- USDA Economic Research Service, "Food Security in the U.S." https://www.ers.usda.gov/topics/food-nutrition-assistance/food-security-in-the-u-s
- Associated Press, reporting on the discontinuation of the USDA annual Household Food Security Report (September 2025).
- Center on Budget and Policy Priorities, "TANF Reaching Few Poor Families." https://www.cbpp.org/research/income-security/tanf-reaching-few-poor-families
- Center on Budget and Policy Priorities, "Policy Basics: Temporary Assistance for Needy Families." https://www.cbpp.org/research/income-security/policy-basics-temporary-assistance-for-needy-families
- Urban Institute, Welfare Rules Database. https://wrd.urban.org/
- Social Security Administration, "Understanding Supplemental Security Income: SSI Resources." https://www.ssa.gov/ssi/text-resources-ussi.htm
- Administration for Children and Families, Low Income Home Energy Assistance Program. https://www.acf.hhs.gov/ocs/programs/liheap
- Health Resources and Services Administration, Bureau of Primary Health Care (Health Center Program). https://bphc.hrsa.gov/
- United Way Worldwide, 211 network. https://www.211.org/
- KFF, "Status of State Medicaid Expansion Decisions." https://www.kff.org/medicaid/issue-brief/status-of-state-medicaid-expansion-decisions/
- Congressional Budget Office, "Effective Marginal Tax Rates for Low- and Moderate-Income Workers" (November 2015). https://www.cbo.gov/publication/50923
- Consumer Financial Protection Bureau, "Data Point: Payday Lending" (2014). https://www.consumerfinance.gov/data-research/research-reports/cfpb-data-point-payday-lending/
- National Consumer Law Center, state high-cost lending analyses. https://www.nclc.org/
- Consumer Financial Protection Bureau, "Single-Payment Vehicle Title Lending" (2016). https://www.consumerfinance.gov/data-research/research-reports/single-payment-vehicle-title-lending/
- Consumer Financial Protection Bureau, "CFPB Research Shows Banks' Deep Dependence on Overdraft Fees" (2021). https://www.consumerfinance.gov/about-us/newsroom/cfpb-research-shows-banks-deep-dependence-on-overdraft-fees/
- Consumer Financial Protection Bureau, "CFPB Finalizes Rule to Close Overdraft Loophole" (Dec. 12, 2024). https://www.consumerfinance.gov/about-us/newsroom/cfpb-finalizes-rule-to-close-overdraft-loophole-and-save-americans-billions/
- Congress.gov, S.J.Res. 18, 119th Congress (disapproving the CFPB overdraft rule). https://www.congress.gov/bill/119th-congress/senate-joint-resolution/18
- Consumer Financial Protection Bureau, interpretive rule on earned-wage-access products, 89 Fed. Reg. 61388 (July 31, 2024); withdrawn 2025.
- Consumer Financial Protection Bureau, finalized rule removing medical bills from credit reports (January 2025); vacated by a federal court in Texas (July 2025) after the agency declined to defend it.
- FDIC, National Survey of Unbanked and Underbanked Households. https://www.fdic.gov/household-survey
- Federal Reserve, "Changes in U.S. Family Finances from 2019 to 2022" (October 2023). https://www.federalreserve.gov/publications/october-2023-changes-in-us-family-finances-from-2019-to-2022.htm
- The Pew Charitable Trusts, "How Debt Collectors Are Transforming the Business of State Courts" (2020). https://www.pewtrusts.org/en/research-and-analysis/reports/2020/05/how-debt-collectors-are-transforming-the-business-of-state-courts
- U.S. Department of Labor, Wage and Hour Division, Fact Sheet 30: Federal Wage Garnishment Law. https://www.dol.gov/agencies/whd/fact-sheets/30-cppa
- United States Courts, Bankruptcy Court Fees. https://www.uscourts.gov/services-forms/fees/bankruptcy-court-fees
- Foohey, Lawless, Porter, and Thorne, "Life in the Sweatbox," Notre Dame Law Review 94, no. 1 (2018).
- Princeton University Eviction Lab, National Estimates. https://evictionlab.org/national-estimates/
- U.S. Department of Housing and Urban Development, Annual Homeless Assessment Report (2024 point-in-time count). https://www.huduser.gov/portal/datasets/ahar.html
- Jacobson, LaLonde, and Sullivan, "Earnings Losses of Displaced Workers," American Economic Review 83, no. 4 (1993): 685–709.
- Prison Policy Initiative, "Out of Prison & Out of Work" (2018). https://www.prisonpolicy.org/reports/outofwork.html
- U.S. Census Bureau, "Poverty in the United States: 2022" (P60-280). https://www.census.gov/library/publications/2023/demo/p60-280.html
- Congressional Budget Office, estimated budgetary effects of Public Law 119-21 (2025), cbo.gov.
Comments (5)
Continue exploring
Mamdani's 9/11 Records Release: What New York Officials Knew About Ground Zero's Toxic Air
Twenty-five years after the attacks, Mayor Mamdani released 170,000 pages of NYC 9/11 records. Here is what they reveal about the…
Inside India's Plan to Let AI Agents Spend Money on UPI
India is exploring how AI agents could spend money on UPI without a human approving each transaction, a test of machine identity…
Could a "Rogue AI" Cyberattack Push America Onto Stablecoin Rails?
A cyberattack blamed on rogue AI could accelerate America's shift toward stablecoins and tokenized deposits, and the legal…
Quick question — was Gerald's survival guide dominating those search results for a while, or is that kind of vendor displacement a more recent shift?
Fantastic framing, but I'm skeptical that 'rock bottom' doesn't meaningfully exist — what evidence actually supports the claim that moving between systems always lands people somewhere viable?
Your treatment of the medical bankruptcy debate is refreshingly honest about definitional disputes. A follow-up examining how consumer protection policy should weigh estimates ranging from 4 percent to 66.5 percent would be genuinely useful for state-level reform efforts.
The point about unemployment insurance reaching only one in four jobless workers matches what I've seen in my own caseload data. Among 140 clients who lost jobs in 2024, only 31 received any unemployment payment, and the median delay between filing and first check ran just over seven weeks.
In my intake work at a legal aid office, the search-results-to-payday-loan pipeline described here is exactly what I see. Clients routinely arrive having followed the 211 advice, hit waitlists, and then been steered into products they couldn't evaluate, which makes the Gerald-app-as-survival-guide phenomenon far more representative than exceptional.